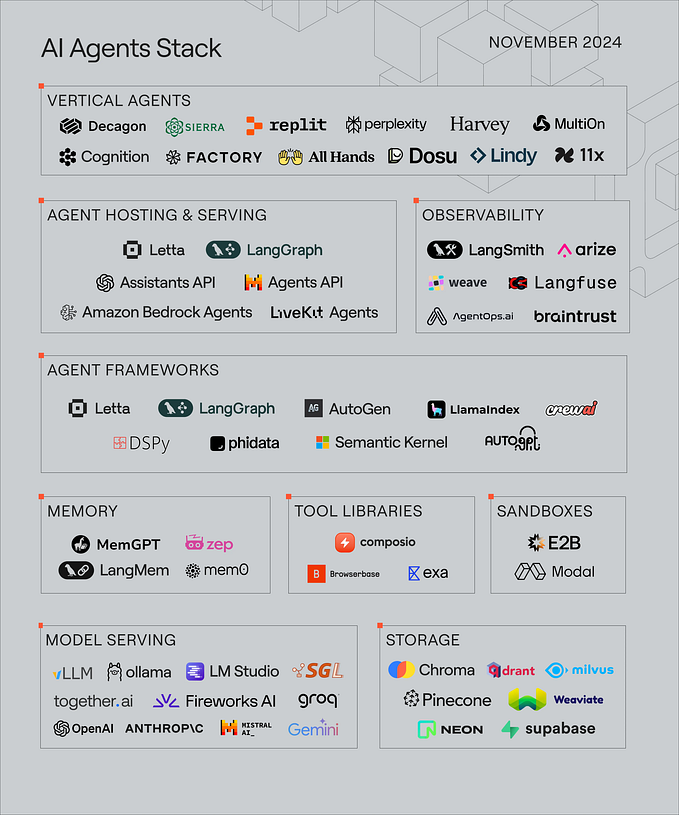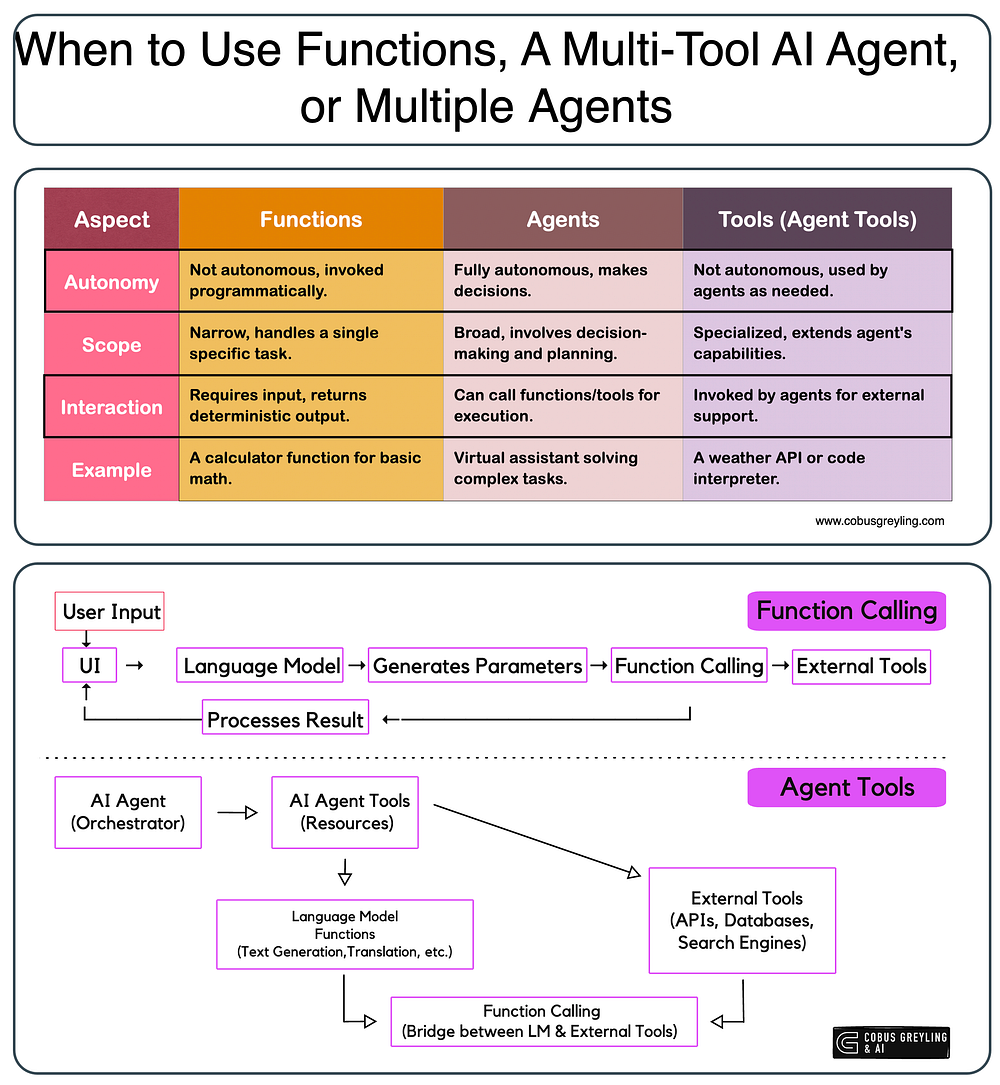
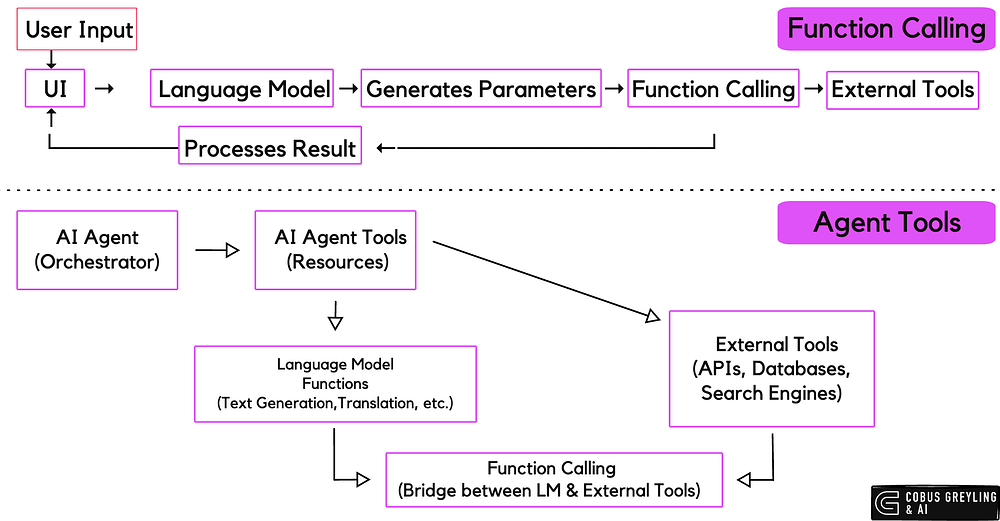
When to Use Functions, a Multi-Tool AI Agent, or Multiple Agents
Sometimes, a single agent with multiple tools is enough — or even just functions.
AI Agents, Tools & Functions
Something I find strange, is that not more people are speaking about the significance of functions, and that functions is an easy way to introduce a level of structure and agentic orchestration to a LLM-based applications.
There is also an argument to be made that if functionality is simple, a function can be defined for each of the tasks. The function is described in natural language which guides the Language Model on when to make use of which function.
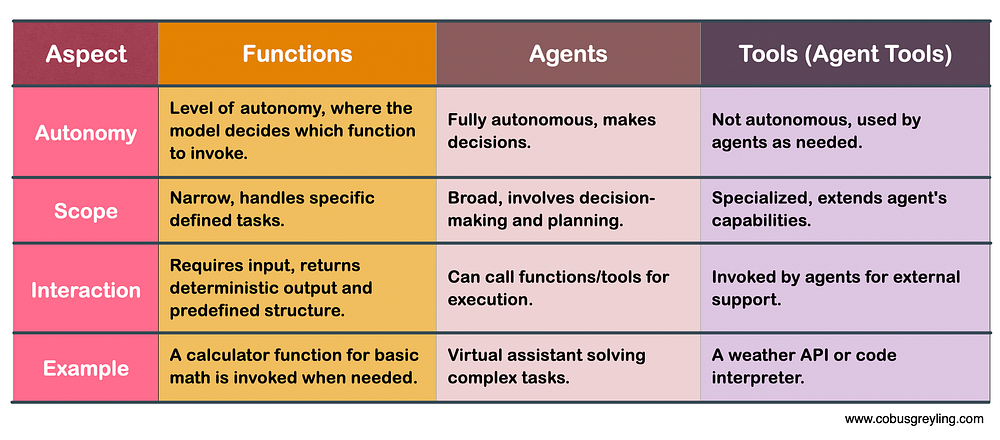
Then there is a scenario where level of autonomy and the complexity of the tasks demand that an AI Agent is introduced.
A step up from this, is when a single AI Agent has too many tools assigned to it, and it makes sense to decompose the task and have specialised AI Agents that are able to solve specific tasks or sub-tasks, which will increase the overall system performance.
AI Agents Overview & Tools
AI agents are designed to autonomously perform tasks & make decisions, often by leveraging various tools to enhance their capabilities.
Two fundamental tools commonly integrated into AI agents are math and search functionalities.
In order to establish a clear view of the role of tools, considering the article below…
Here I attempt to show a simplified version of an AI Agent with access to only two tools:
Math Tool:
- Purpose: Enables the agent to perform calculations, solve equations, and handle numerical data.
- Functionality: Allows the agent to process mathematical queries, analyse data sets, and provide accurate numerical responses.
- Example: An agent calculating financial projections or solving complex engineering problems.
Search Tool:
- Purpose: Empowers the agent to retrieve information from various sources, including databases and the internet.
- Functionality: Enables the agent to access up-to-date information, verify facts, and gather data to inform its decisions.
- Example: An agent providing the latest news updates or sourcing academic articles for research purposes.
pip install -U langchain-community
pip install google-search-results
pip install openai==0.28
from langchain.agents import load_tools
from langchain.agents import initialize_agent
from langchain.agents import AgentType
# Instead of importing OpenAI, import ChatOpenAI:
from langchain.chat_models import ChatOpenAI # Import ChatOpenAI for chat models
import os
os.environ['OPENAI_API_KEY'] = str("Your OpenAI API key")
os.environ["SERPAPI_API_KEY"] = str("Your SERP API key")
llm = ChatOpenAI(temperature=0, model_name='gpt-4-0314') # Use ChatOpenAI and define model_name here
tools = load_tools(["serpapi", "llm-math"], llm=llm)
# Initialize the agent with handle_parsing_errors=True
agent = initialize_agent(tools,
llm,
agent=AgentType.ZERO_SHOT_REACT_DESCRIPTION,
verbose=True,
handle_parsing_errors=True)
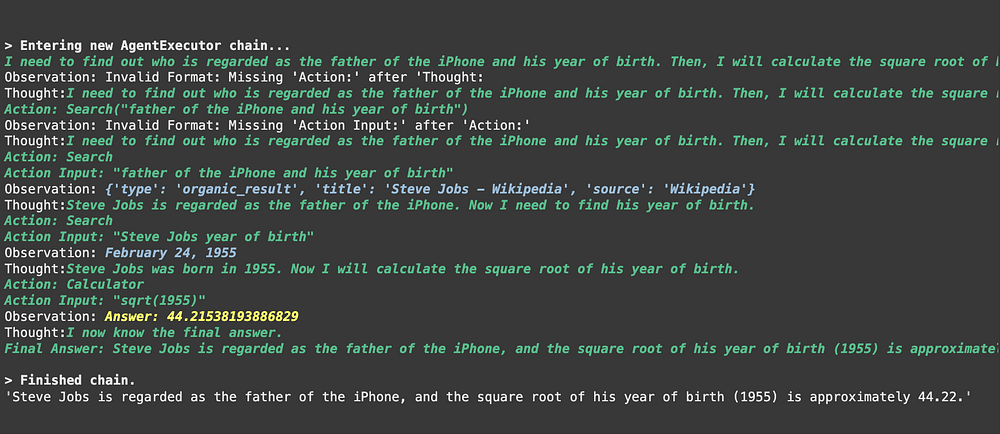
agent.run("Who is regarded as the farther of the iPhone and what is the square root of his year of birth?")Here is the response from the Agent in text and the screenshot from the notebook:
> Entering new AgentExecutor chain...
I need to find out who is regarded as the father of the iPhone and his year of birth. Then, I will calculate the square root of his year of birth.
Observation: Invalid Format: Missing 'Action:' after 'Thought:
Thought:I need to find out who is regarded as the father of the iPhone and his year of birth. Then, I will calculate the square root of his year of birth.
Action: Search("father of the iPhone and his year of birth")
Observation: Invalid Format: Missing 'Action Input:' after 'Action:'
Thought:I need to find out who is regarded as the father of the iPhone and his year of birth. Then, I will calculate the square root of his year of birth.
Action: Search
Action Input: "father of the iPhone and his year of birth"
Observation: {'type': 'organic_result', 'title': 'Steve Jobs - Wikipedia', 'source': 'Wikipedia'}
Thought:Steve Jobs is regarded as the father of the iPhone. Now I need to find his year of birth.
Action: Search
Action Input: "Steve Jobs year of birth"
Observation: February 24, 1955
Thought:Steve Jobs was born in 1955. Now I will calculate the square root of his year of birth.
Action: Calculator
Action Input: "sqrt(1955)"
Observation: Answer: 44.21538193886829
Thought:I now know the final answer.
Final Answer: Steve Jobs is regarded as the father of the iPhone, and the square root of his year of birth (1955) is approximately 44.22.

> Finished chain.
Steve Jobs is regarded as the father of the iPhone, and the square root of his year of birth (1955) is approximately 44.22.
And the output from the LangChain AI Agent:
Multi-Agent Environment
In this cookbook, OpenAI shows how Structured Outputs can be used to build powerful multi-agent systems.
Structured Outputs is an exciting new capability that extends the functionality of JSON mode and function calling, enabling developers to enforce a strict schema on a model’s output.
By leveraging the strict: true parameter, we can ensure that the model’s response adheres precisely to a predefined schema, making it more reliable and predictable.
To showcase the potential of this feature, the notebook below construct a multi-agent system.
But why would you want to build such a system?
Here’s the key insight: as the number of tools in your AI system grows, performance can start to degrade.
This is where multi-agent systems shine.
By logically grouping tools and assigning them to specialised AI Agents, each focused on solving specific tasks or sub-tasks, you can significantly boost the overall efficiency and performance of your system.
This approach not only streamlines workflows but also allows each AI Agent to excel in its designated role, creating a more robust and scalable AI ecosystem.
Whether you’re building a complex workflow or optimizing tool usage, multi-agent systems offer a compelling solution to manage complexity and enhance performance.
Below the basic setup…
pip install openai

from openai import OpenAI
from IPython.display import Image
import json
import os
import pandas as pd
import matplotlib.pyplot as plt
from io import StringIO
import numpy as np

# Set the environment variable
os.environ['OPENAI_API_KEY'] = 'Your OpenAI API Key'

client = OpenAI()
Then the model is defined…
MODEL = "gpt-4o-2024-08-06"Below the four agents are defined in natural language and the tools at the disposal of each agent is defined:
- Triaging agent: Decides which agent(s) to call
- Data pre-processing Agent: Prepares data for analysis — for example by cleaning it up
- Data Analysis Agent: Performs analysis on the data
- Data Visualization Agent: Visualizes the output of the analysis to extract insights
triaging_system_prompt = """You are a Triaging Agent. Your role is to assess the user's query and route it to the relevant agents. The agents available are:
- Data Processing Agent: Cleans, transforms, and aggregates data.
- Analysis Agent: Performs statistical, correlation, and regression analysis.
- Visualization Agent: Creates bar charts, line charts, and pie charts.

Use the send_query_to_agents tool to forward the user's query to the relevant agents. Also, use the speak_to_user tool to get more information from the user if needed."""

processing_system_prompt = """You are a Data Processing Agent. Your role is to clean, transform, and aggregate data using the following tools:
- clean_data
- transform_data
- aggregate_data"""

analysis_system_prompt = """You are an Analysis Agent. Your role is to perform statistical, correlation, and regression analysis using the following tools:
- stat_analysis
- correlation_analysis
- regression_analysis"""

visualization_system_prompt = """You are a Visualization Agent. Your role is to create bar charts, line charts, and pie charts using the following tools:
- create_bar_chart
- create_line_chart
- create_pie_chart"""
Here the tools are defined:
riage_tools = [
    {
        "type": "function",
        "function": {
            "name": "send_query_to_agents",
            "description": "Sends the user query to relevant agents based on their capabilities.",
            "parameters": {
                "type": "object",
                "properties": {
                    "agents": {
                        "type": "array",
                        "items": {"type": "string"},
                        "description": "An array of agent names to send the query to."
                    },
                    "query": {
                        "type": "string",
                        "description": "The user query to send."
                    }
                },
                "required": ["agents", "query"]
            }
        },
        "strict": True
    }
]

preprocess_tools = [
    {
        "type": "function",
        "function": {
            "name": "clean_data",
            "description": "Cleans the provided data by removing duplicates and handling missing values.",
            "parameters": {
                "type": "object",
                "properties": {
                    "data": {
                        "type": "string",
                        "description": "The dataset to clean. Should be in a suitable format such as JSON or CSV."
                    }
                },
                "required": ["data"],
                "additionalProperties": False
            }
        },
        "strict": True
    },
    {
        "type": "function",
        "function": {
            "name": "transform_data",
            "description": "Transforms data based on specified rules.",
            "parameters": {
                "type": "object",
                "properties": {
                    "data": {
                        "type": "string",
                        "description": "The data to transform. Should be in a suitable format such as JSON or CSV."
                    },
                    "rules": {
                        "type": "string",
                        "description": "Transformation rules to apply, specified in a structured format."
                    }
                },
                "required": ["data", "rules"],
                "additionalProperties": False
            }
        },
        "strict": True

    },
    {
        "type": "function",
        "function": {
            "name": "aggregate_data",
            "description": "Aggregates data by specified columns and operations.",
            "parameters": {
                "type": "object",
                "properties": {
                    "data": {
                        "type": "string",
                        "description": "The data to aggregate. Should be in a suitable format such as JSON or CSV."
                    },
                    "group_by": {
                        "type": "array",
                        "items": {"type": "string"},
                        "description": "Columns to group by."
                    },
                    "operations": {
                        "type": "string",
                        "description": "Aggregation operations to perform, specified in a structured format."
                    }
                },
                "required": ["data", "group_by", "operations"],
                "additionalProperties": False
            }
        },
        "strict": True
    }
]


analysis_tools = [
    {
        "type": "function",
        "function": {
            "name": "stat_analysis",
            "description": "Performs statistical analysis on the given dataset.",
            "parameters": {
                "type": "object",
                "properties": {
                    "data": {
                        "type": "string",
                        "description": "The dataset to analyze. Should be in a suitable format such as JSON or CSV."
                    }
                },
                "required": ["data"],
                "additionalProperties": False
            }
        },
        "strict": True
    },
    {
        "type": "function",
        "function": {
            "name": "correlation_analysis",
            "description": "Calculates correlation coefficients between variables in the dataset.",
            "parameters": {
                "type": "object",
                "properties": {
                    "data": {
                        "type": "string",
                        "description": "The dataset to analyze. Should be in a suitable format such as JSON or CSV."
                    },
                    "variables": {
                        "type": "array",
                        "items": {"type": "string"},
                        "description": "List of variables to calculate correlations for."
                    }
                },
                "required": ["data", "variables"],
                "additionalProperties": False
            }
        },
        "strict": True
    },
    {
        "type": "function",
        "function": {
            "name": "regression_analysis",
            "description": "Performs regression analysis on the dataset.",
            "parameters": {
                "type": "object",
                "properties": {
                    "data": {
                        "type": "string",
                        "description": "The dataset to analyze. Should be in a suitable format such as JSON or CSV."
                    },
                    "dependent_var": {
                        "type": "string",
                        "description": "The dependent variable for regression."
                    },
                    "independent_vars": {
                        "type": "array",
                        "items": {"type": "string"},
                        "description": "List of independent variables."
                    }
                },
                "required": ["data", "dependent_var", "independent_vars"],
                "additionalProperties": False
            }
        },
        "strict": True
    }
]

visualization_tools = [
    {
        "type": "function",
        "function": {
            "name": "create_bar_chart",
            "description": "Creates a bar chart from the provided data.",
            "parameters": {
                "type": "object",
                "properties": {
                    "data": {
                        "type": "string",
                        "description": "The data for the bar chart. Should be in a suitable format such as JSON or CSV."
                    },
                    "x": {
                        "type": "string",
                        "description": "Column for the x-axis."
                    },
                    "y": {
                        "type": "string",
                        "description": "Column for the y-axis."
                    }
                },
                "required": ["data", "x", "y"],
                "additionalProperties": False
            }
        },
        "strict": True
    },
    {
        "type": "function",
        "function": {
            "name": "create_line_chart",
            "description": "Creates a line chart from the provided data.",
            "parameters": {
                "type": "object",
                "properties": {
                    "data": {
                        "type": "string",
                        "description": "The data for the line chart. Should be in a suitable format such as JSON or CSV."
                    },
                    "x": {
                        "type": "string",
                        "description": "Column for the x-axis."
                    },
                    "y": {
                        "type": "string",
                        "description": "Column for the y-axis."
                    }
                },
                "required": ["data", "x", "y"],
                "additionalProperties": False
            }
        },
        "strict": True
    },
    {
        "type": "function",
        "function": {
            "name": "create_pie_chart",
            "description": "Creates a pie chart from the provided data.",
            "parameters": {
                "type": "object",
                "properties": {
                    "data": {
                        "type": "string",
                        "description": "The data for the pie chart. Should be in a suitable format such as JSON or CSV."
                    },
                    "labels": {
                        "type": "string",
                        "description": "Column for the labels."
                    },
                    "values": {
                        "type": "string",
                        "description": "Column for the values."
                    }
                },
                "required": ["data", "labels", "values"],
                "additionalProperties": False
            }
        },
        "strict": True
    }
]
This maps a tool call to the corresponding function. It then appends the output of the function to the conversation history.
def clean_data(data):
    data_io = StringIO(data)
    df = pd.read_csv(data_io, sep=",")
    df_deduplicated = df.drop_duplicates()
    return df_deduplicated

def stat_analysis(data):
    data_io = StringIO(data)
    df = pd.read_csv(data_io, sep=",")
    return df.describe()

def plot_line_chart(data):
    data_io = StringIO(data)
    df = pd.read_csv(data_io, sep=",")

    x = df.iloc[:, 0]
    y = df.iloc[:, 1]

    coefficients = np.polyfit(x, y, 1)
    polynomial = np.poly1d(coefficients)
    y_fit = polynomial(x)

    plt.figure(figsize=(10, 6))
    plt.plot(x, y, 'o', label='Data Points')
    plt.plot(x, y_fit, '-', label='Best Fit Line')
    plt.title('Line Chart with Best Fit Line')
    plt.xlabel(df.columns[0])
    plt.ylabel(df.columns[1])
    plt.legend()
    plt.grid(True)
    plt.show()

# Define the function to execute the tools
def execute_tool(tool_calls, messages):
    for tool_call in tool_calls:
        tool_name = tool_call.function.name
        tool_arguments = json.loads(tool_call.function.arguments)

        if tool_name == 'clean_data':
            # Simulate data cleaning
            cleaned_df = clean_data(tool_arguments['data'])
            cleaned_data = {"cleaned_data": cleaned_df.to_dict()}
            messages.append({"role": "tool", "name": tool_name, "content": json.dumps(cleaned_data)})
            print('Cleaned data: ', cleaned_df)
        elif tool_name == 'transform_data':
            # Simulate data transformation
            transformed_data = {"transformed_data": "sample_transformed_data"}
            messages.append({"role": "tool", "name": tool_name, "content": json.dumps(transformed_data)})
        elif tool_name == 'aggregate_data':
            # Simulate data aggregation
            aggregated_data = {"aggregated_data": "sample_aggregated_data"}
            messages.append({"role": "tool", "name": tool_name, "content": json.dumps(aggregated_data)})
        elif tool_name == 'stat_analysis':
            # Simulate statistical analysis
            stats_df = stat_analysis(tool_arguments['data'])
            stats = {"stats": stats_df.to_dict()}
            messages.append({"role": "tool", "name": tool_name, "content": json.dumps(stats)})
            print('Statistical Analysis: ', stats_df)
        elif tool_name == 'correlation_analysis':
            # Simulate correlation analysis
            correlations = {"correlations": "sample_correlations"}
            messages.append({"role": "tool", "name": tool_name, "content": json.dumps(correlations)})
        elif tool_name == 'regression_analysis':
            # Simulate regression analysis
            regression_results = {"regression_results": "sample_regression_results"}
            messages.append({"role": "tool", "name": tool_name, "content": json.dumps(regression_results)})
        elif tool_name == 'create_bar_chart':
            # Simulate bar chart creation
            bar_chart = {"bar_chart": "sample_bar_chart"}
            messages.append({"role": "tool", "name": tool_name, "content": json.dumps(bar_chart)})
        elif tool_name == 'create_line_chart':
            # Simulate line chart creation
            line_chart = {"line_chart": "sample_line_chart"}
            messages.append({"role": "tool", "name": tool_name, "content": json.dumps(line_chart)})
            plot_line_chart(tool_arguments['data'])
        elif tool_name == 'create_pie_chart':
            # Simulate pie chart creation
            pie_chart = {"pie_chart": "sample_pie_chart"}
            messages.append({"role": "tool", "name": tool_name, "content": json.dumps(pie_chart)})
    return messages
Next, we will create the tool handlers for each of the sub-agents.
These have a unique prompt and tool set passed to the model.
The output is then passed to an execution function which runs the tool calls.
We will also append the messages to the conversation history.
# Define the functions to handle each agent's processing
def handle_data_processing_agent(query, conversation_messages):
    messages = [{"role": "system", "content": processing_system_prompt}]
    messages.append({"role": "user", "content": query})

    response = client.chat.completions.create(
        model=MODEL,
        messages=messages,
        temperature=0,
        tools=preprocess_tools,
    )

    conversation_messages.append([tool_call.function for tool_call in response.choices[0].message.tool_calls])
    execute_tool(response.choices[0].message.tool_calls, conversation_messages)

def handle_analysis_agent(query, conversation_messages):
    messages = [{"role": "system", "content": analysis_system_prompt}]
    messages.append({"role": "user", "content": query})

    response = client.chat.completions.create(
        model=MODEL,
        messages=messages,
        temperature=0,
        tools=analysis_tools,
    )

    conversation_messages.append([tool_call.function for tool_call in response.choices[0].message.tool_calls])
    execute_tool(response.choices[0].message.tool_calls, conversation_messages)

def handle_visualization_agent(query, conversation_messages):
    messages = [{"role": "system", "content": visualization_system_prompt}]
    messages.append({"role": "user", "content": query})

    response = client.chat.completions.create(
        model=MODEL,
        messages=messages,
        temperature=0,
        tools=visualization_tools,
    )

    conversation_messages.append([tool_call.function for tool_call in response.choices[0].message.tool_calls])
    execute_tool(response.choices[0].message.tool_calls, conversation_messages)
Finally, we create the overarching tool to handle processing the user query.
This function takes the user query, gets a response from the model and handles passing it to the other agents to execute. In addition to this, we will keep the state of the ongoing conversation.
# Function to handle user input and triaging
def handle_user_message(user_query, conversation_messages=[]):
    user_message = {"role": "user", "content": user_query}
    conversation_messages.append(user_message)


    messages = [{"role": "system", "content": triaging_system_prompt}]
    messages.extend(conversation_messages)

    response = client.chat.completions.create(
        model=MODEL,
        messages=messages,
        temperature=0,
        tools=triage_tools,
    )

    conversation_messages.append([tool_call.function for tool_call in response.choices[0].message.tool_calls])

    for tool_call in response.choices[0].message.tool_calls:
        if tool_call.function.name == 'send_query_to_agents':
            agents = json.loads(tool_call.function.arguments)['agents']
            query = json.loads(tool_call.function.arguments)['query']
            for agent in agents:
                if agent == "Data Processing Agent":
                    handle_data_processing_agent(query, conversation_messages)
                elif agent == "Analysis Agent":
                    handle_analysis_agent(query, conversation_messages)
                elif agent == "Visualization Agent":
                    handle_visualization_agent(query, conversation_messages)

    return conversation_messages
And running the multi-agent:
user_query = """
Below is some data. I want you to first remove the duplicates then analyze the statistics of the data as well as plot a line chart.

house_size (m3), house_price ($)
90, 100
80, 90
100, 120
90, 100
"""

handle_user_message(user_query)
And the result:
Cleaned data:     house_size (m3)   house_price ($)
0               90               100
1               80                90
2              100               120
Statistical Analysis:         house_size  house_price
count    4.000000     4.000000
mean    90.000000   102.500000
std      8.164966    12.583057
min     80.000000    90.000000
25%     87.500000    97.500000
50%     90.000000   100.000000
75%     92.500000   105.000000
max    100.000000   120.000000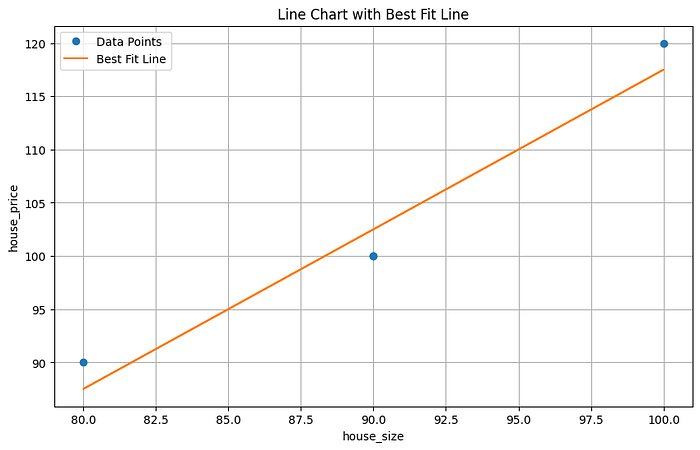
[{'role': 'user',
  'content': '\nBelow is some data. I want you to first remove the duplicates then analyze the statistics of the data as well as plot a line chart.\n\nhouse_size (m3), house_price ($)\n90, 100\n80, 90\n100, 120\n90, 100\n'},
 [Function(arguments='{"agents": ["Data Processing Agent"], "query": "Remove duplicates from the data: house_size (m3), house_price ($)\\n90, 100\\n80, 90\\n100, 120\\n90, 100"}', name='send_query_to_agents'),
  Function(arguments='{"agents": ["Analysis Agent"], "query": "Analyze the statistics of the data: house_size (m3), house_price ($)\\n90, 100\\n80, 90\\n100, 120\\n90, 100"}', name='send_query_to_agents'),
  Function(arguments='{"agents": ["Visualization Agent"], "query": "Plot a line chart for the data: house_size (m3), house_price ($)\\n90, 100\\n80, 90\\n100, 120\\n90, 100"}', name='send_query_to_agents')],
 [Function(arguments='{"data":"house_size (m3), house_price ($)\\n90, 100\\n80, 90\\n100, 120\\n90, 100"}', name='clean_data')],
 {'role': 'tool',
  'name': 'clean_data',
  'content': '{"cleaned_data": {"house_size (m3)": {"0": 90, "1": 80, "2": 100}, " house_price ($)": {"0": 100, "1": 90, "2": 120}}}'},
 [Function(arguments='{"data":"house_size,house_price\\n90,100\\n80,90\\n100,120\\n90,100"}', name='stat_analysis')],
 {'role': 'tool',
  'name': 'stat_analysis',
  'content': '{"stats": {"house_size": {"count": 4.0, "mean": 90.0, "std": 8.16496580927726, "min": 80.0, "25%": 87.5, "50%": 90.0, "75%": 92.5, "max": 100.0}, "house_price": {"count": 4.0, "mean": 102.5, "std": 12.583057392117917, "min": 90.0, "25%": 97.5, "50%": 100.0, "75%": 105.0, "max": 120.0}}}'},
 [Function(arguments='{"data":"house_size,house_price\\n90,100\\n80,90\\n100,120\\n90,100","x":"house_size","y":"house_price"}', name='create_line_chart')],
 {'role': 'tool',
  'name': 'create_line_chart',
  'content': '{"line_chart": "sample_line_chart"}'}]
Chief Evangelist @ Kore.ai | I’m passionate about exploring the intersection of AI and language. From Language Models, AI Agents to Agentic Applications, Development Frameworks & Data-Centric Productivity Tools, I share insights and ideas on how these technologies are shaping the future.